The GSC performance reports are the core of Google Search Console. GSC Helper works with all performance reports („normal performance report“, Discover, and News) and offers different advanced reports. All reports can be run via a click on the extension logo, via the context menu, or, when active, via the GSC Helper action bar.
Table of content
Advanced reports
For search queries
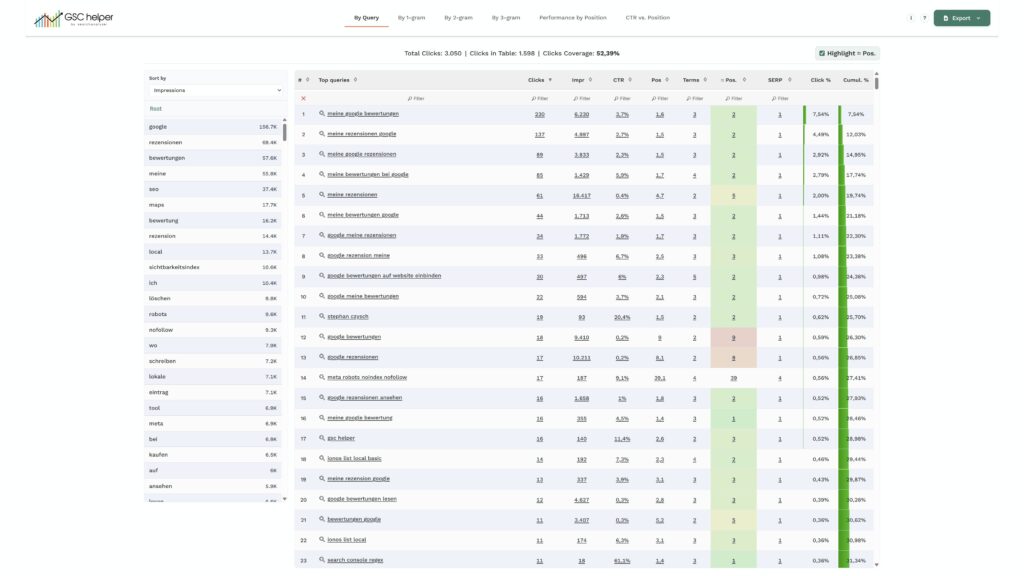
While you view your search queries, the corresponding advanced report will display them in a nicer way. The search queries are split into various n-gram combinations and can be visualized by position or CTR.
Highlights
- Clicks Coverage: Google only provides a fraction of all search queries leading to clicks. GSC Helper sums up all clicks in up to 1,000 samples and divides them by the total clicks. Usually, the clicks‘ coverage is 30 to 40 percent, meaning that only 3 to 4 out of 10 clicks can be attributed to a search query!
- N-Gram view: Use the left table to drill down the sample queries for a specific n-gram.
- Click share: Click share tells you how much of the reported clicks can be attributed to a single query and helps you to understand how dependent the site traffic is on a specific query.
- Performance by Position: This visualization aggregates your search query stats by position. See the sum of clicks and impressions per position and start optimizing queries that get a lot of impressions but rank lower.
- CTR vs. position: This visualization shows you CTR outliers by plotting search query CTR by position. Look for search queries that have a significantly lower CTR than other queries ranking in the same position.
For pages
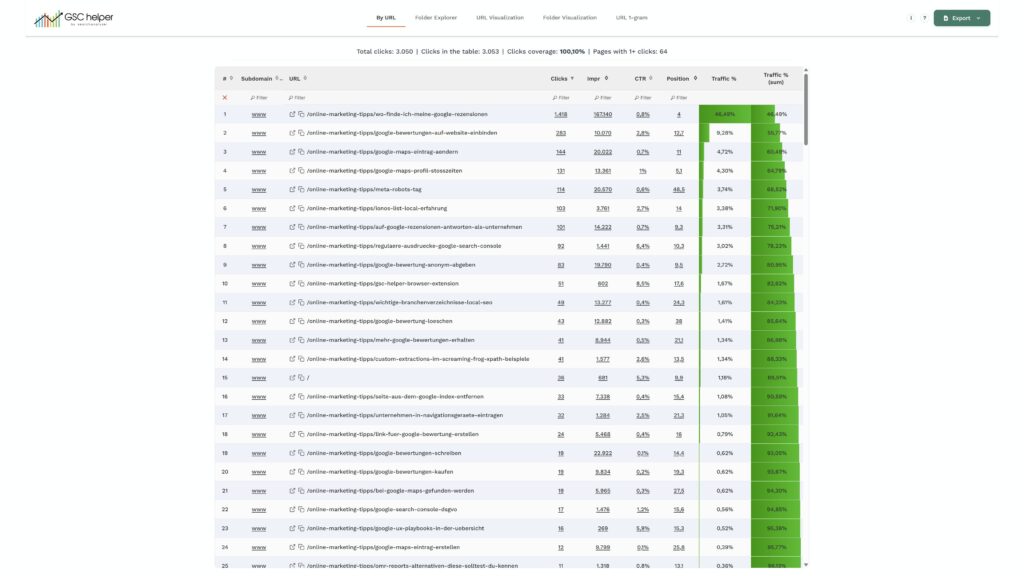
While you view your page performance, the advanced report will aggregate the URL performance based on folders and calculate the traffic share of each URL. This quickly shows you how dependent your traffic is on single URLs.
Highlights
- Traffic share: Some pages perform better than others—see how much of the total traffic goes to a single URL and how much traffic your x best pages generate.
- Folder explorer: By extracting the folders from the URL, GSC Helper offers an alternative way to analyze your website performance. What is the traffic generated by a folder? How many pages does that folder report? Plus: Quickly verify a folder as a separate property to get even more data from GSC!
- URL visualization: A simple but powerful visualization! See how reliant your website is on the traffic of single URLs.
- Folder visualization: Visualizes the performance by clicks and impressions in a chart. See which folders tend to perform better than others.
For dates
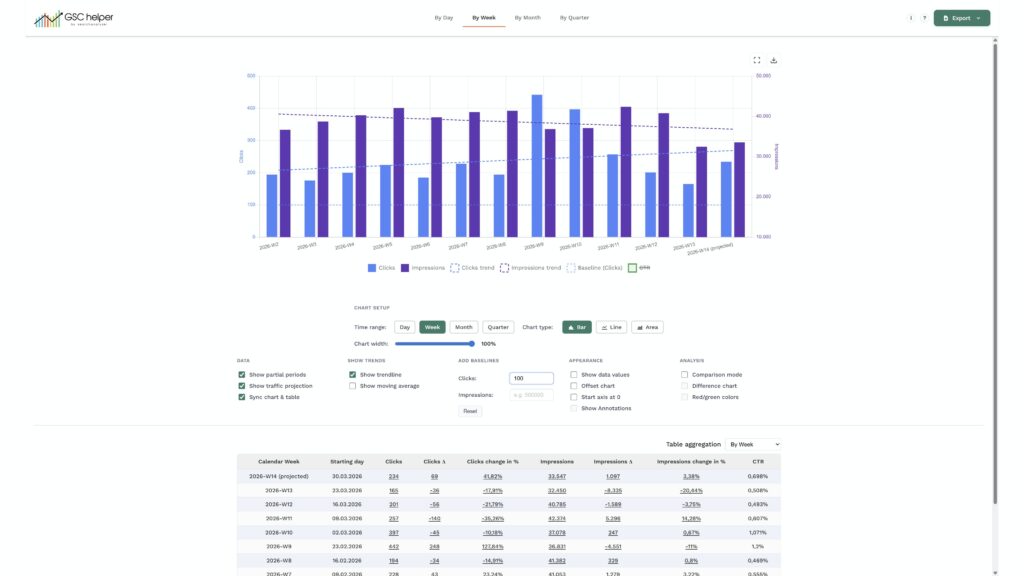
Until December 2025, Google Search Console did not provide a way to view your data in any aggregation other than by days, which made it difficult to spot traffic trends. While viewing your date performance, the advanced report provides a nicer visualization with various additional data points, like direct comparison links, deltas, trendlines, and baselines!
Highlights
- Custom aggregations: Aggregate your search performance by day, week, month, or quarter and hide or show partial months. Or get a traffic projection.
- Compare links & deltas: See the difference in clicks and impressions vs. the previous period. Click on the delta values to directly compare the periods against each other.
- Show annotations & trendlines: When you use the native GSC annotations, GSC Helper can display them in the chart. On top of that, you can add trendlines and baselines to your chart.
- Overlay Google Updates: Show the roll-out period of Google updates directly in the chart.
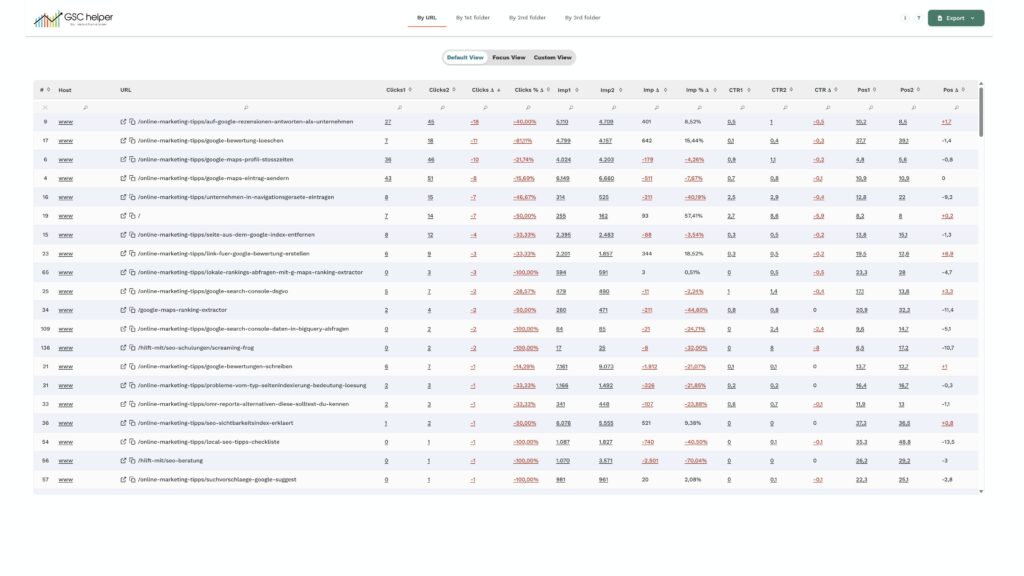
For queries (compare view)
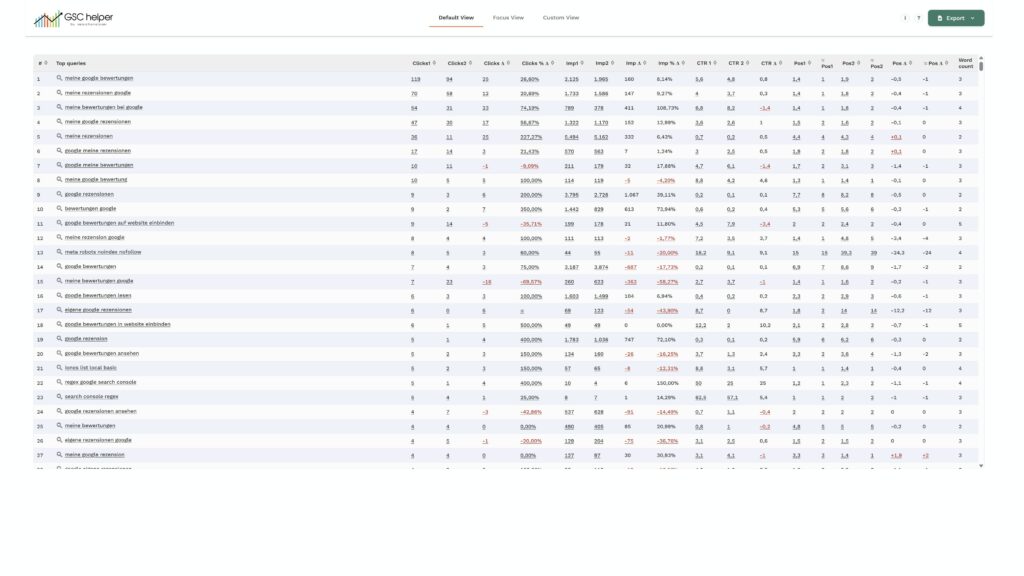
When you compare the performance for two periods, the compare view provided by GSC Helper enriches the data with % changes and more.
Highlights
- Period-specific deeplinks: Click on the stats of a single period to analyze the query in that particular time frame.
- Easily compare query performance over time: Want to dig deeper into the performance of different queries? Click on any of the delta columns to do so!
- Custom Views: Feeling overwhelmed by data? Use the different views in the main navigation to reduce the noise!
For pages (compare view)
As Google is not providing all queries, analyzing performance on a URL basis is the best starting point.
Highlights
- Automatic traffic aggregation by folder: Spot which folders lost most traffic by using the „by .. folder“ views.
- Period-specific deeplinks: Click on the stats of a single period to analyze the page in that particular time frame.
- Easily compare page performance over time: Want to dig deeper into the performance of different pages? Click on any of the delta columns to do so!
GSC action bar
The GSC action bar injects a powerful configuration section into the search analytics report (and others) and can be deactivated via the options menu of GSC Helper. Alternatively, you can close it temporarily by clicking on the x.
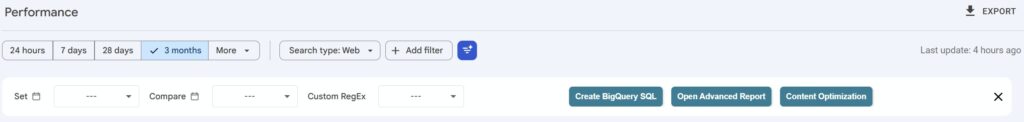
Run Reports
Usually called „Advanced Report“, a click on this button will open the advanced GSC Helper report (if one is available for your current view).
Set Dates
Set dates simplify setting dates in GSC by offering additional date ranges like „Quarter to date“ or selecting a single month like „June 2026“. It also shows the default date ranges Google offers.
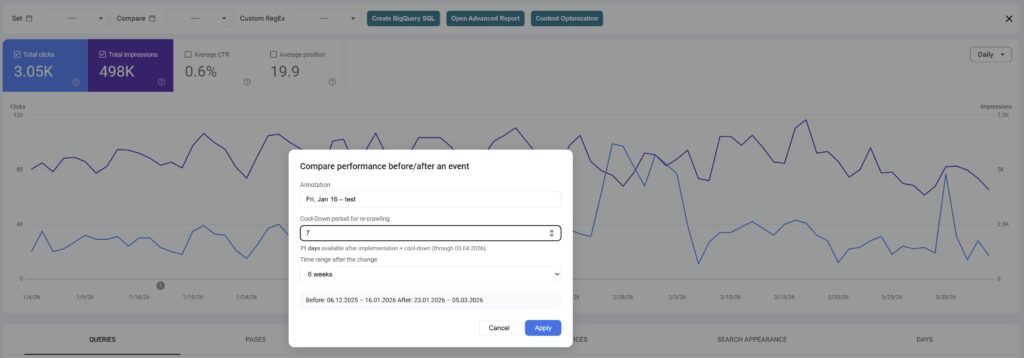
Compare Dates
Do you want to quickly compare your performance against a specific period? Use the preset date ranges and try out the powerful „Before/after an event“ function. It extracts the date of an annotation, lets you define the cool-down period (so Google can re-crawl your site), and calculates the available date range. Then select the period and see the website performance compared before and after the event.
Apply RegEx filter
In the options, you can define your custom RegEx statements and apply them via the drop-down. If you don’t want to remember this complex RegEx to filter out e.g., branded queries, just save it once and load it whenever you need it.
Note: A click on custom RegEx will open the options menu to set or update your RegEx filters.
Create BigQuery SQL
Everyone should use the native BigQuery data export from Google Search Console, as this massively increases the data coverage. As writing BigQuery SQL is not for everyone, I built gscbigquery.com. When you hit the button, your current configuration from the GSC interface is used to preset the configuration fields of the tool. Make additional changes when needed, and get a BigQuery SQL in seconds.
Content Optimization
Content Optimization was added with GSC Helper 2.4 and allows checking your on-site content against search queries. Easily see if you are using popular search queries in your content and in HTML markup. Find more on the content optimization tool here.
Via the context menu (right-mouse button click), you can find an alternative way to run all the reports listed above and some pre-configured regex patterns for traffic segmentation.
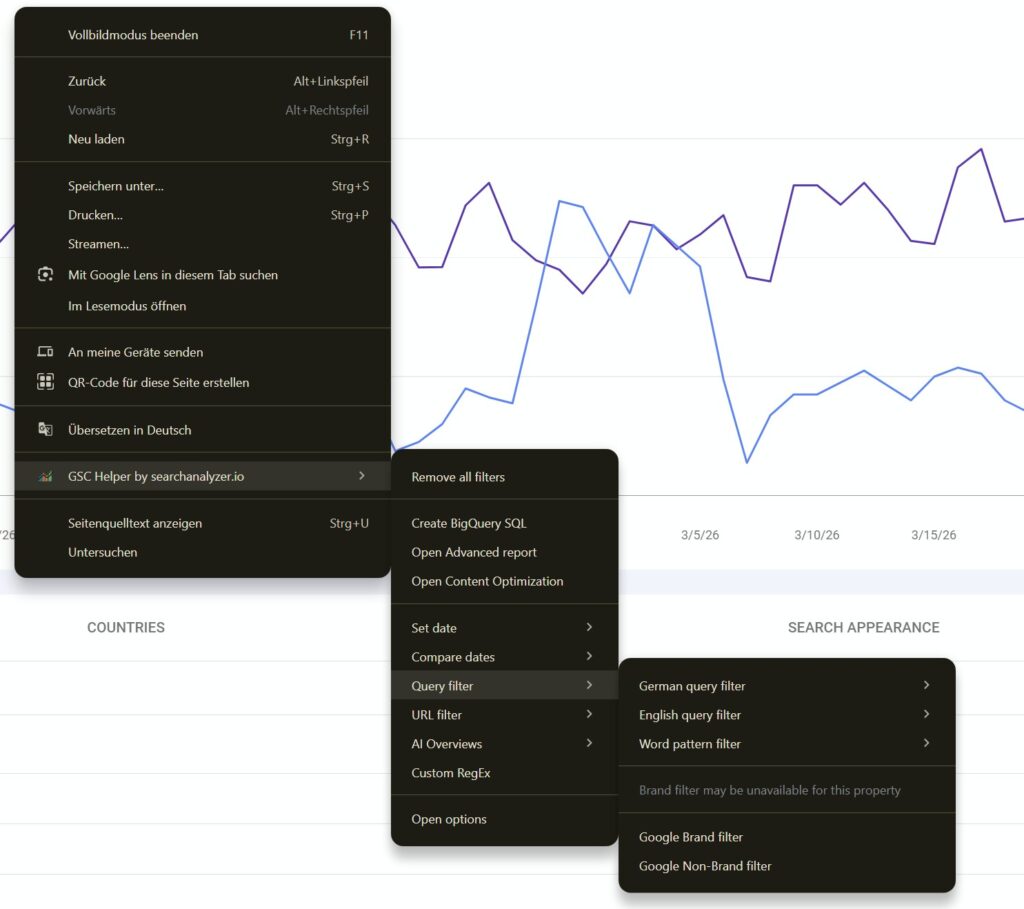
Query filter
The preset filters are available:
- German query filters – Questions: Filters for typical questions. Check the applied RegEx for details.
- German query filters – Transactional terms: Filters for typical transactional / buying-intent searches. Check the applied RegEx for details.
- English query filters – Questions: Filters for typical questions. Check the applied RegEx for details.
- English query filter – Transactional terms: Filters for typical transactional / buying-intent searches. Check the applied RegEx for details.
- Word pattern filter: Filters for 1, 2, 3, or more than 3 word queries, or for queries including at least two digits (to find, e.g., years).
- Brand / Non-Brand filter: Google started offering a brand/non-brand segmentation. The context menu offers an alternative way to apply this filter.
URL filter
Select preset filters to analyze your traffic.
- URLs with 3+ folders: Filter for URLs with more than 3 folders
- URLs with parameters: Filters for URLs containing at least one parameter
- URLs with #: Identify sitelinks by filtering for URLs containing a #
- URLs with special characters: Shows URL that containing „non-common“ characters
- URLs ending with slash: Only shows URLs that end with a slash
- URLs not ending with slash: Shows all URLs that do not end with a slash
- URLs in root: Only surfaces URLs within the root folder
AI Overviews
As AI Overview tracers can both be found by filtering for queries or URLs, this separate group was formed. It lists selected filters from the query and URL menu to help trace rankings in AI Overviews.
Note: As Google is not offering a native filter, it’s not possible to isolate AI Overviews in GSC, so take the data as hints.