Thanks for using GSC Helper 🎉
In case something is unclear, take a look at the linked FAQ document. If a question is still unanswered, please leave a comment, get in touch with me via email at stephan@searchanalyzer.io, or connect on LinkedIn.
If you are looking for the update notes, please follow the link. Sometimes you will discover details on new functions in the update notes, but not here (yet). 😉
I also try my best to include informative descriptions in the extension itself—either in the configuration or by adding titles to added functions.
Feature list
General FAQ
Does the extension require my Google Account login or API access?
Only when you want to use the Google Search Console API features. By default, GSC Helper does not require OAuth access or API keys. GSC Helper acts as a visual overlay, displaying the data from your current Google Search Console view in a nicer way by parsing the source code. The data is not send to us or any third party.
How do I use the extension?
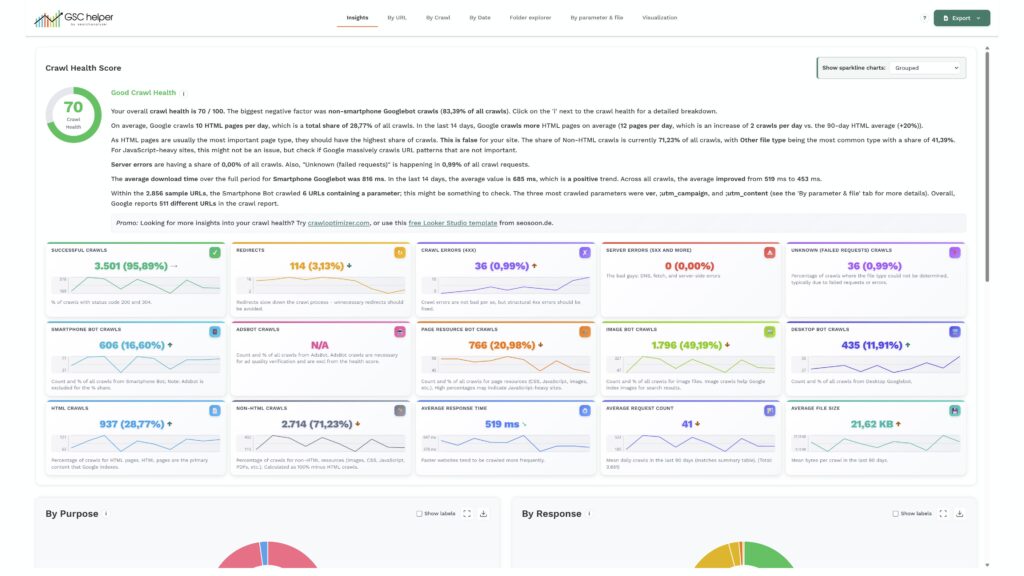
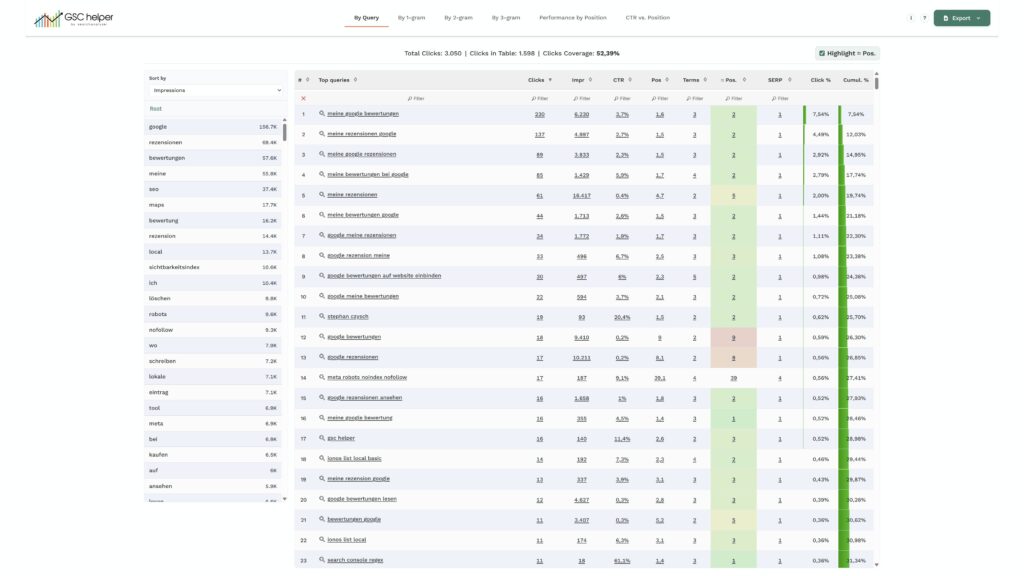
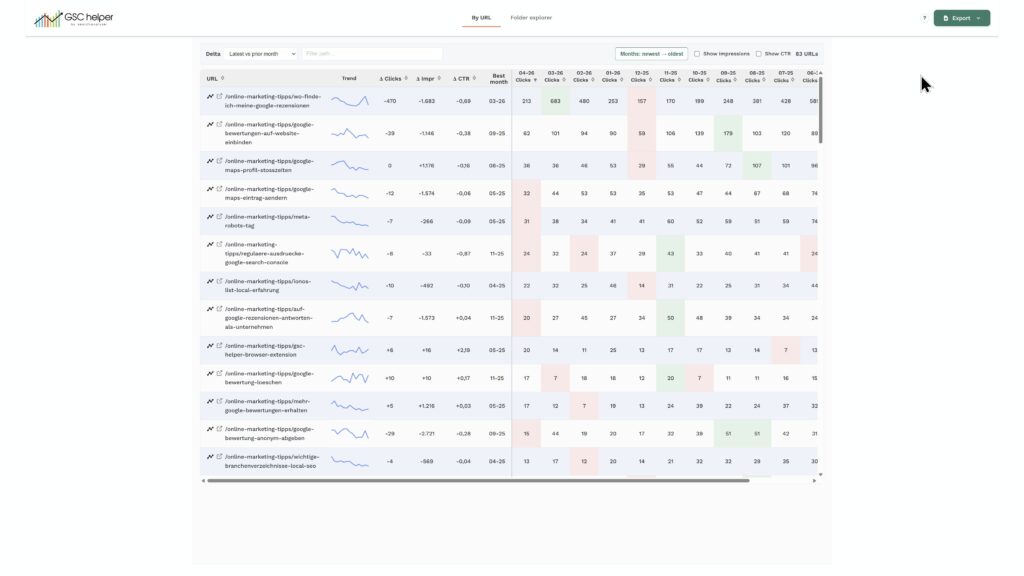
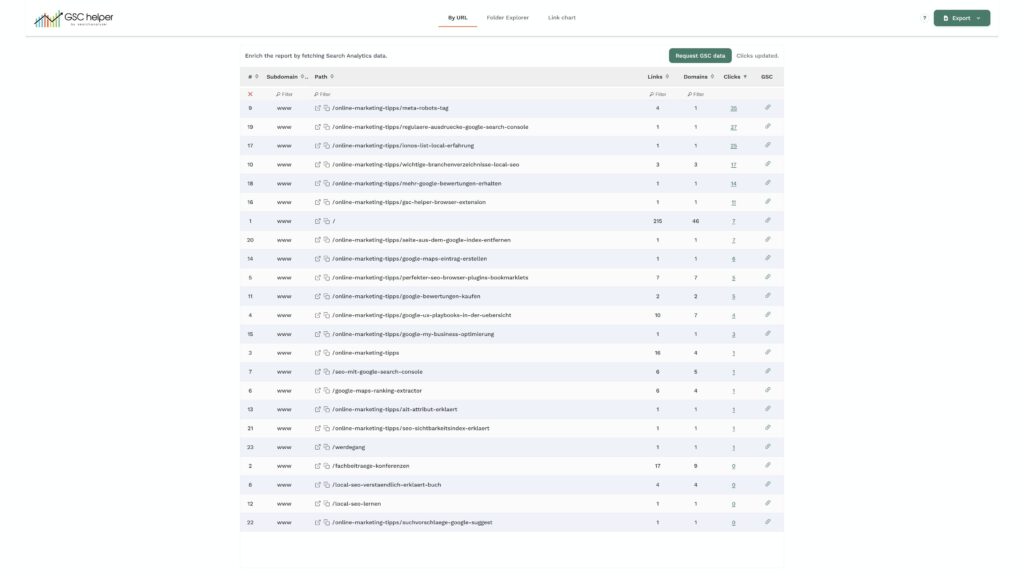
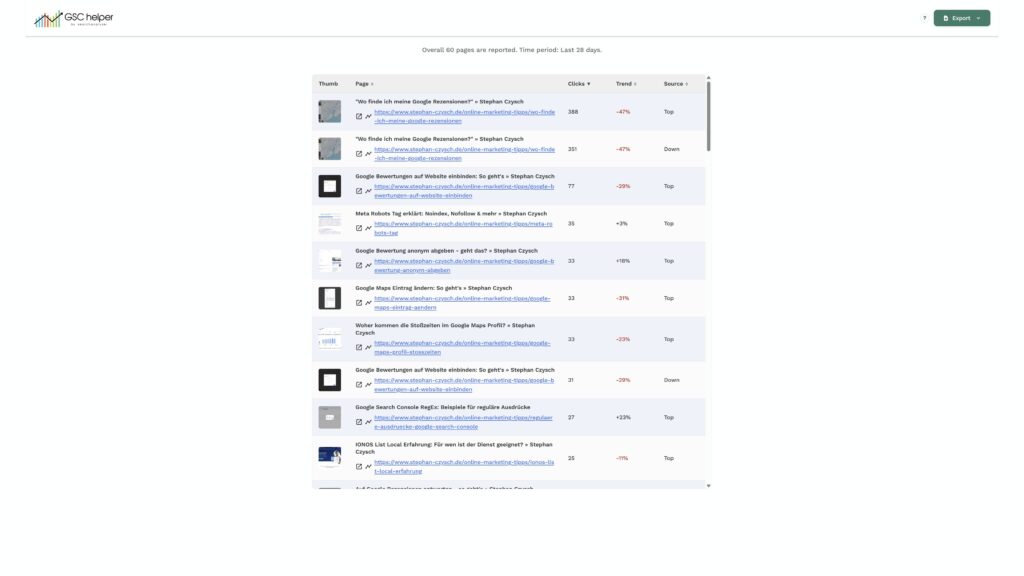
Simply click the extension icon, the buttons in the „GSC Helper action bar,“ or use the right-click context menu while viewing your Google Search Console (GSC) report. GSC Helper automatically analyzes the data on your screen to add helpful visualizations and insights.
🔒 Privacy First: All processing happens locally in your browser. Your data is never sent to us or third parties.
Is GSC Helper an official Google product?
No. GSC Helper is a third-party browser extension. Google Search Console and its data remain Google’s; the extension only helps you use that interface more efficiently.
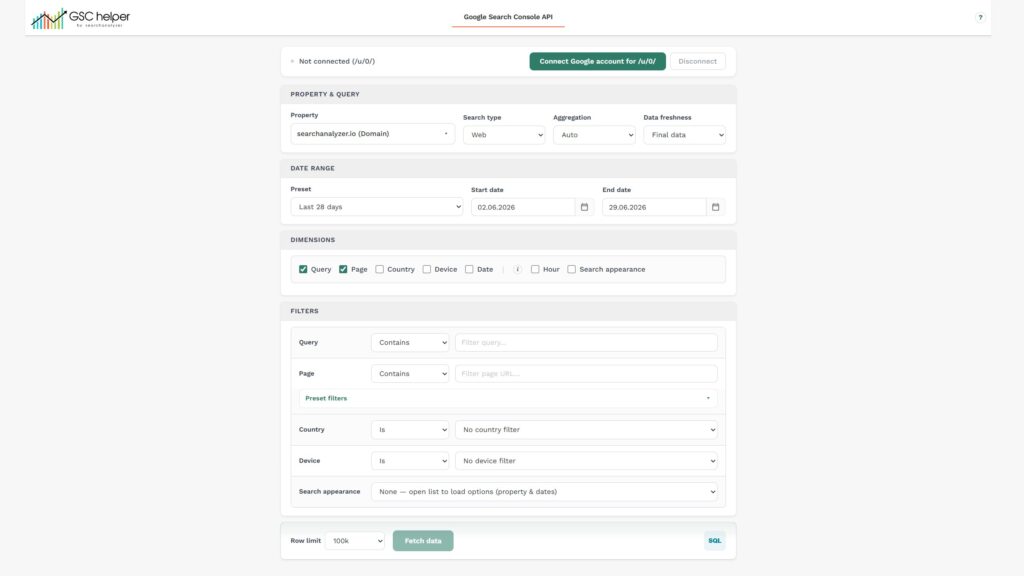
How does GSC Helper query different Search Console reports and combine the results?
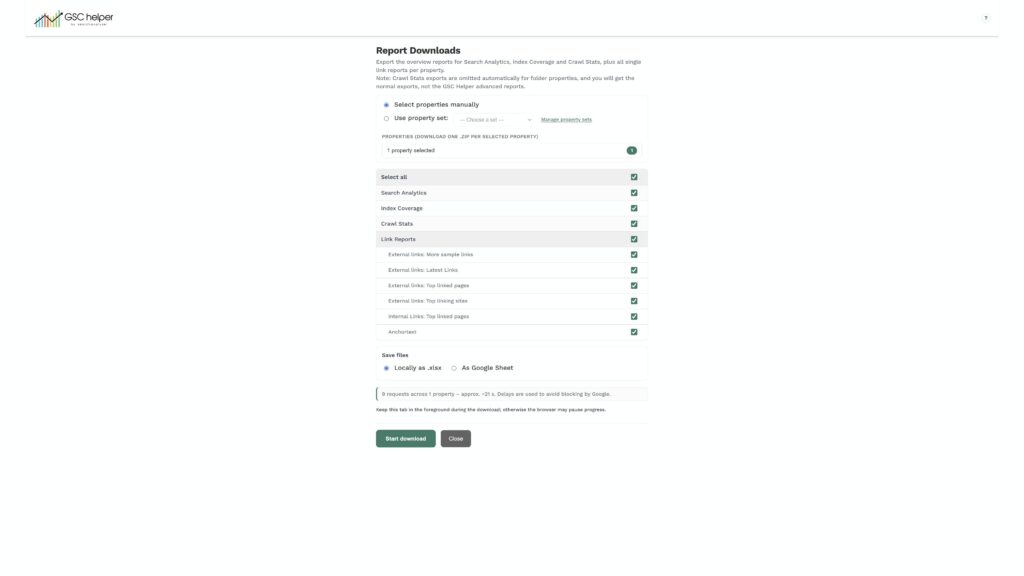
GSC Helper uses your active Google Search Console session. For bulk exports (for example from Report Downloads), it builds the same kind of requests the Search Console UI uses—each report type maps to the appropriate Search Console URL with your property (resource_id), report parameters, and export format. Your browser then requests those files.
For views that need more detail than a single export can provide at once, the extension may run several exports in sequence (for example with different report IDs) and merge the rows in your browser—typically by URL or another stable key—so you get one combined picture without double-counting where the logic is designed to avoid overlap.
In all cases, the underlying numbers still come from Google; the extension organizes, merges, and presents them—it does not replace Google’s reporting engine.
Why does the extension ask for permissions like tabs, storage, or downloads?
We limit the permission requests as much as possible. Due to the design of Google Chrome, some information is unavailable without those permission rights.
E.g. Tabs and scripting allow the extension to interact with open Search Console tabs and retrieve data. Storage permission is used to save your settings. „All sites“ access is needed to create links to Google Search Console; without it, we would not know which domain or URL to pass.
The toolbar or buttons do not show up. What should I do?
Google Search Console is a „Single Page Application“ (SPA). Sometimes the plugin attempts to inject the buttons before the GSC interface has finished loading.
Try a Hard Refresh: Press
Ctrl + F5(Windows) orCmd + Shift + R(Mac).Wait 2–3 seconds after the page loads to see if the buttons appear.
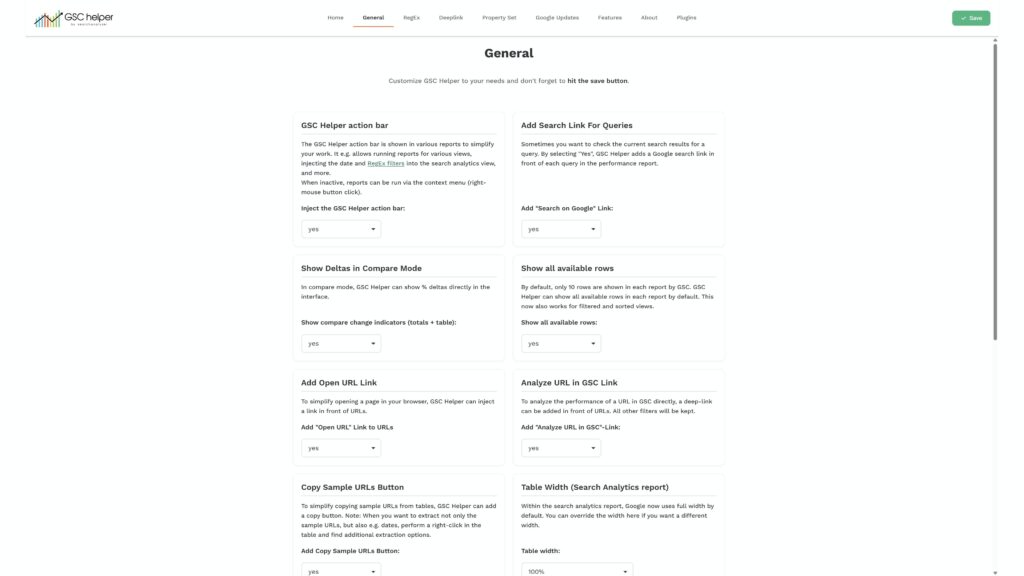
Can I turn off notifications or specific injected features?
Yes— open the extension’s options page and disable what you do not need.
Does the extension work if my Search Console is set to a language other than English?
Yes, GSC Helper is built to be language-agnostic. It identifies data structures within the interface regardless of whether your GSC is set to German, English, or any other supported language.
Can I only allow GSC Helper to only run on certain websites?
Yes, you can easily restrict GSC Helper to only run where you need it.
Right-click the GSC Helper icon in your toolbar.
Hover over „This can read and change site data.“
Choose your preferred level of access:
When you click the extension: The extension stays „off“ until you manually click it.
On domain.tld: It will only activate when you are on specified domains.
On all sites: (Default) It stays active everywhere.
What causes data being incorrect / not shown?
Google Search Console is a single page application (SPA) and keeps prior visits in the source code. As a result, you may see incorrect or missing data when changing views or properties. To ensure that only the current data is in the source, refresh the page.
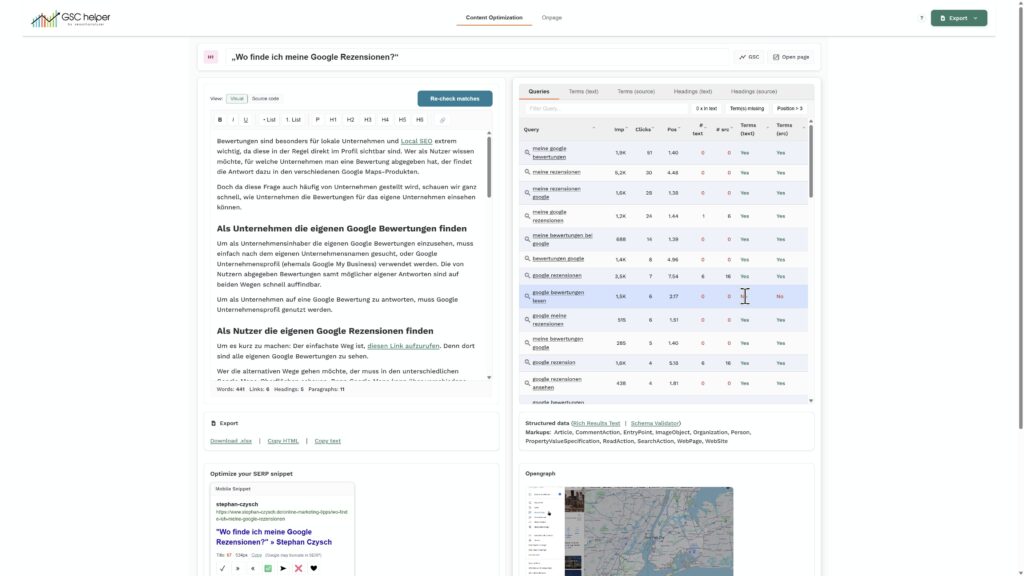
What is the difference between GSC Helper and searchanalyzer.io?
GSC Helper is a browser-based „workflow booster“ for immediate, on-the-go analysis of your current view. Searchanalyzer.io is our full platform designed for long-term data monitoring, deep content optimization, and strategic performance tracking across your entire history.