Google Search Console shows index status for today — but not always how it changed over time. The native overview is limited, and GSC’s own history window is relatively short.
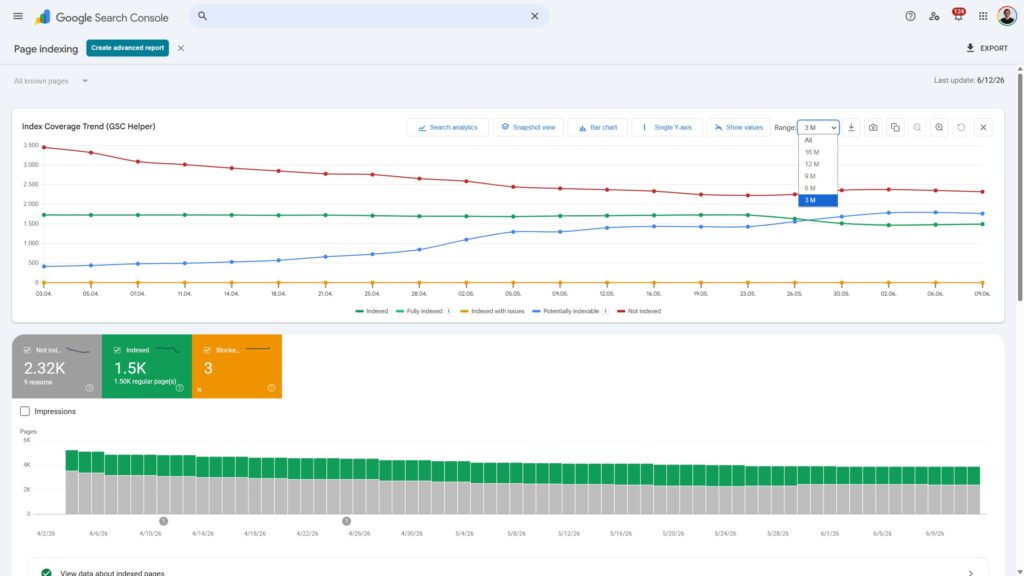
The Index Coverage Trend chart in GSC Helper adds a clear timeline directly on the Page indexing overview: indexed pages, issues, potentially indexable URLs, and not-indexed pages — including a Fully indexed line that cuts through GSC’s headline noise.
All data is read and processed locally in your browser. Nothing is sent to searchanalyzer.io unless you explicitly turn on optional overlays (see below).
Where to find it
- Open Page indexing in Google Search Console (the main overview — not a drilldown report).
- GSC Helper injects the Index Coverage Trend chart below the main content.
- If you don’t see it: hard-refresh the page (
Ctrl+F5/Cmd+Shift+R) and wait a few seconds — GSC is a single-page app.
Enable or disable:
Right-click the extension icon → Options → General → Show Index Coverage Trend chart.
What the chart shows
Each point on the timeline reflects your property’s index coverage on that date:
| Series | What it means |
|---|---|
| Indexed | Total indexed pages (GSC’s default “Indexed pages” count) |
| Fully indexed | Indexed pages excluding Indexed, though blocked by robots.txt and Page indexed without content — often a truer picture of healthy indexation |
| Indexed with issues | Pages indexed despite known issues |
| Potentially indexable | Crawled or discovered — currently not indexed |
| Not indexed | Pages Google reports as not indexed |
Tip: Click legend items to hide or show individual series. Use Scale: Dual to put indexed metrics on the left axis and potentially indexable / not indexed on the right — useful when volumes differ a lot.
Chart controls
Display
- Line chart or grouped bar chart
- Dual scale — separate Y-axes for indexed vs. non-indexed series
- Data labels — show values on the chart
- Zoom — drag on the chart to select a range, or use the +/- toolbar buttons (
Escaperesets zoom)
History period
Use the Period dropdown to change the visible range:
- 3 M — matches GSC’s normal embed window (no stored history required)
- 6 M / 9 M / 12 M / 16 M / All — extend the chart with Data History (see below)
Click the period label to open Options → Data History and manage stored snapshots.
Export
- Download XLSX — chart data as Snapshot and Daily sheets
- Save / copy chart as PNG — for reports and presentations
- Close (×) — hide the chart on this property until you reload GSC
Go beyond GSC’s short window: Data History
GSC only embeds a limited history in the Page indexing UI. GSC Helper can store daily snapshots while you work in Search Console and merge them into the trend chart.
Setup (one time):
- Open Options → Data History.
- Enable auto-capture (all properties, or track/exclude specific ones).
- Visit Page indexing regularly — each visit can add a snapshot for that property.
Result: Period presets like 12 M or All show a longer, continuous trend — including gap markers when a day was missed.
You can also import past data (CSV/JSON backups) or export your stored history from the Data History tab.
Optional: Search analytics overlay
The chart toolbar includes a Search analytics toggle. When enabled, GSC Helper overlays clicks and impressions on the same timeline — helpful when you want to see whether index changes correlate with traffic.
This uses your active Search Console session. Data stays in the browser.
A timeline mode toggle switches between snapshot intervals (when GSC reports changed) and a daily view (when stored history or the analytics overlay is active).
Index Coverage Trend vs. Index Insights
Both features deal with indexing — but they answer different questions:
| Index Coverage Trend (in GSC) | Index Insights (extension report) | |
|---|---|---|
| Question | How did coverage change over time? | Which URLs are affected, and in which folders? |
| Where | Embedded on Page indexing overview | Separate report tab |
| Depth | Property-level trend lines | All sample URLs, folder explorer, subgroup table |
| Best for | Monitoring shifts and regressions | Audits, URL lists, sitemap-level analysis |
Running a full Index Insights report also builds an Index Coverage Trend view with extra breakdowns (by parent group / subgroup, submitted vs. not submitted). The in-GSC chart is the lightweight daily monitor; Index Insights is the deep dive.
Highlights
- Trend view on Page indexing — see index coverage change over time without leaving GSC.
- “Fully indexed” metric — clearer than GSC’s raw “Indexed pages” total.
- Extended history — 6–16 months or more with Data History auto-capture or imports.
- Flexible chart — line/bar, dual scale, zoom, data labels, legend toggles.
- Exports — XLSX data + PNG screenshots for reporting.
- Traffic overlay — optional clicks/impressions on the same timeline.
- Privacy-first — reads embedded GSC data in your tab; no cloud processing by default.
Troubleshooting
Chart doesn’t appear
Hard-refresh Page indexing. Confirm Show Index Coverage Trend chart is enabled in Options. Make sure you’re on the overview, not a drilldown (e.g. Crawled – currently not indexed).
“Only one coverage snapshot in this period”
GSC has reported only one change in the selected window. Try a longer period or enable Data History for more data points.
“No coverage changes in the available period”
Counts were flat across the range — the chart may look empty even though data loaded correctly.
Extended period shows little data
You need stored snapshots first. Open Page indexing with auto-capture on, or import history in Options → Data History.