
For large sites, Google Search Console’s 1,000-row sample limit makes index analysis painful. You see a slice of URLs in one report — but not the full picture across indexing statuses, sitemaps, and folders.
Index Insights solves that. GSC Helper requests the index exports you choose, merges them in your browser, and gives you one place to explore all sample URLs, break them down by folder, and track index coverage over time.
All processing stays local in your browser. Your data is not sent to searchanalyzer.io or any third party.
How to open Index Insights
You can start Index Insights from Page indexing in Google Search Console:
Full property report (recommended for audits)
- Open Page indexing (the main overview:
/search-console/index). - Click the GSC Helper extension icon, or right-click → GSC Helper → Open Index Insights.
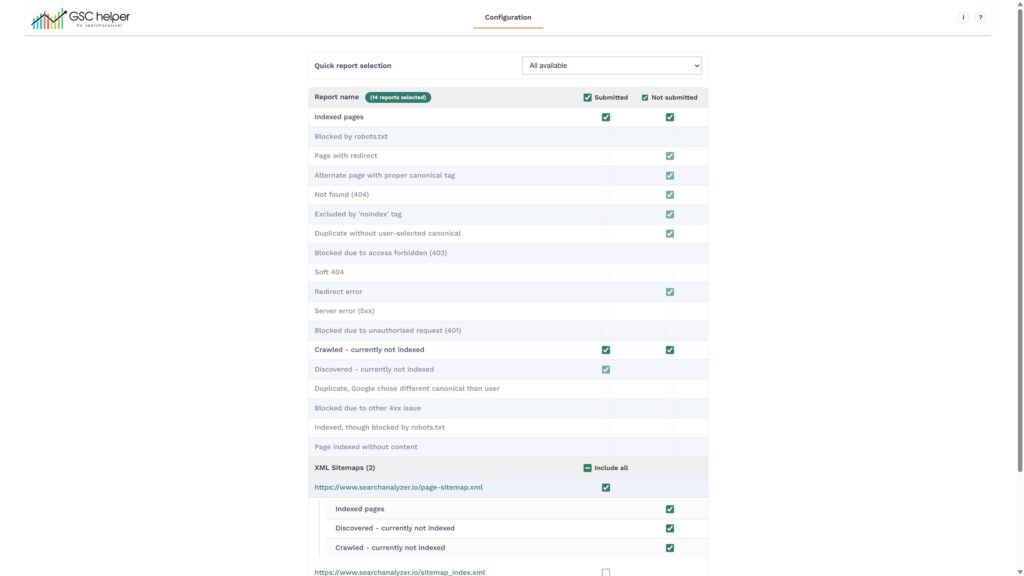
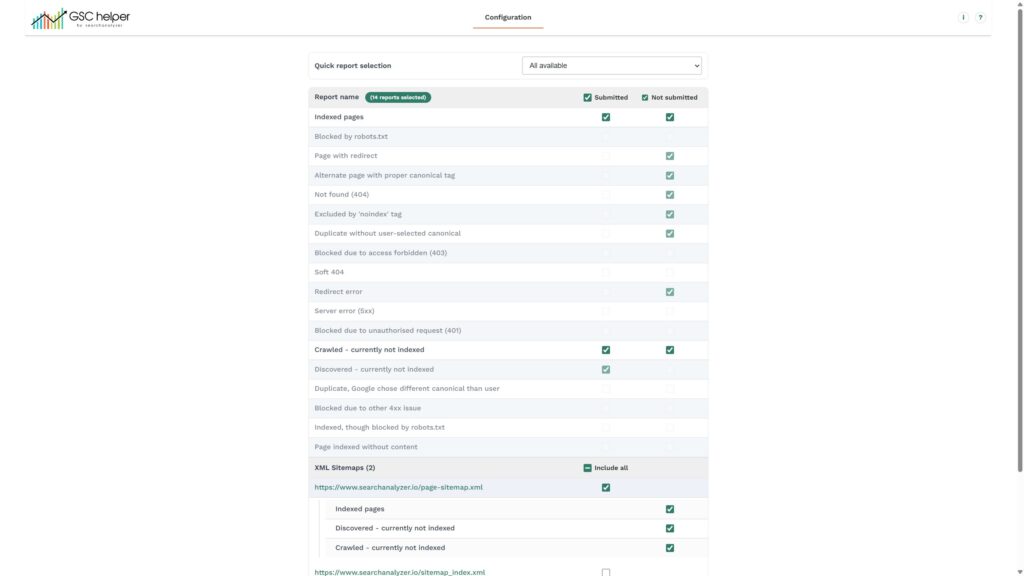
- The Configuration tab opens. GSC Helper checks which reports and XML sitemaps are available for your property.
- Select the reports you need and click Generate report.
Tip: Keep the Index Insights tab in the foreground while the report is generating. Background tabs may run slower or pause progress.
Single-report view (quick look at one table)
- Open a specific Page indexing drilldown (e.g. Crawled – currently not indexed).
- Click the extension icon.
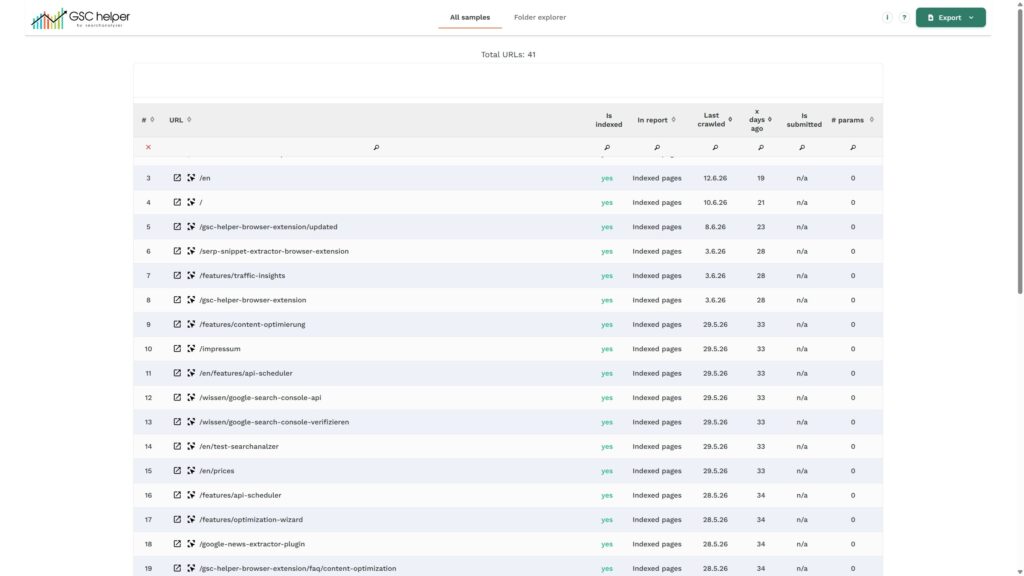
- GSC Helper reads the sample URLs visible in that GSC table and opens All samples directly — enriched with indexing status, report name, and crawl dates.
What you get: four views in one report
Configuration
Before the full run, you choose exactly what to fetch:
- Quick report selection — presets for All available, Indexed pages, or Potentially indexable pages (crawled/discovered – currently not indexed). Fine-tune individual checkboxes anytime.
- Property reports — every indexing reason Google offers for your property, separately for Submitted and Not submitted URLs.
- XML sitemaps — include one or more sitemaps and their sub-reports for sitemap-specific indexing data.
GSC Helper only requests reports that actually exist for your property — unavailable options are detected automatically.
All samples
All selected exports are combined into one sortable, filterable table:
- URL, Is indexed, In report, Is submitted
- Last crawled and × days ago — spot stale URLs that may drop out of the index
- # params — find parameter-heavy URLs quickly
Filter by URL pattern, indexing status, report type, crawl recency, submission status, and more.
Folder explorer
See indexing health by URL folder instead of row by row:
- Navigate folder by folder, or expand to 2nd–5th level in one click
- Counts for # URLs, Indexed pages, and Not indexed pages per folder
- Optional Show individual URLs inside expanded folders
- Open a folder directly in Google Search Console
Ideal for finding which sections of a site carry most indexing issues.
Index Coverage Trend
Track how indexing statuses change over time:
- Chart with indexed, not indexed, and potentially indexable trends
- Switch between Submitted, Not submitted, and All data
- Bar or line chart, dual Y-axis scale, zoom, and fullscreen
- Table views by parent group (coverage categories) or by subgroup (individual report reasons)
- Extend the history period when you use Data History in Options (merged with stored snapshots)
Use this view to spot shifts in index issues — spikes in “Crawled – currently not indexed”, drops in fully indexed pages, and more.
Highlights
- Beyond the 1,000-row limit — combine multiple GSC index exports into one analysis instead of copying samples report by report.
- Automatic report combination — select the reports you need; GSC Helper requests and merges them into a single All samples table.
- XML sitemap support — pull sitemap-level reports alongside property-wide exports.
- “Fully indexed pages” metric — a clearer count that excludes pages like Indexed, though blocked by robots.txt and Page indexed without content, which can inflate GSC’s default “Indexed pages” number.
- Days since last crawl — see how long ago Google last crawled each URL; long gaps often precede de-indexing.
- Folder-level overview — find problematic URL paths without scrolling through thousands of rows.
- Coverage trend over time — chart and table views to monitor indexing shifts, not just a single snapshot.
- Flexible exports — save all tabs as XLSX, export tables as CSV, copy to clipboard, save charts as PNG, or download the raw report files as a .zip.
Good to know
Large properties take time.
A full “All available” run can trigger many downloads. GSC Helper shows progress and throttles requests to reduce the risk of rate limits. For a first test, start with a preset like Indexed pages or one sitemap.
Drilldown vs. overview.
Starting from a single GSC table skips Configuration and opens All samples immediately. Starting from the Page indexing overview gives you the full Configuration workflow including sitemaps and the Index Coverage Trend.
Works in any GSC language.
GSC Helper maps report names across locales (English, German, French, Spanish, and more), so Index Insights works regardless of your Search Console UI language.
Memory management.
After exporting, use Free memory (clear report data) in the Export menu if you no longer need the raw files in RAM. Re-generate the report if you want to download the .zip again.
